In 1989, I put forward a suggestion of how holographic space might be visualised – an attempt to offer a ‘map’ or structure that might help observers consider how this new approach to recording spatial objects and images could function at a fundamental level.
Holographic Space: A Generalised Graphic Definition, Leonardo Journal, Holography as an Art Medium, Special Issue, Vol. 22, Nos. 3 & 4, pp. 295–298.
That original proposal has now been revisited as a source for an implied spatial structure: one that can be controlled by the observer — shifted, rotated and obscured.
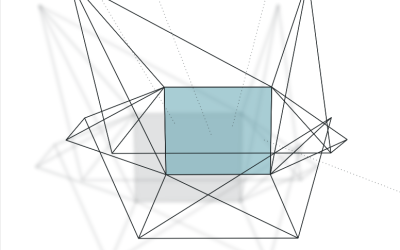
The investigation extends through an interactive 3D model, allowing the observer to explore the spatial relationships between holographic space, its surrounding geometry and two approaches to viewing: a graphic representation and a flat, web-based model.
Title: Holographic Space: A Generalised Graphic Definition – Reapproached
Date: 2026
Dimensions: Variable, Screen-based
Materials: Web HTML code
Edition: Unlimited
The graphic below is not simply an animated presentation of the original drawn proposal. It has been transformed through the coding process, including unintended outcomes arising from the system used to generate it. Convincing but spurious lines, junctions and spatial associations emerge, contradicting aspects of the original drawing while proposing an alternative set of relationships. The result is a progression of the original idea: an unexpected interpretation that extends, rather than simply reproduces, the initial graphic proposition.
What you are seeing
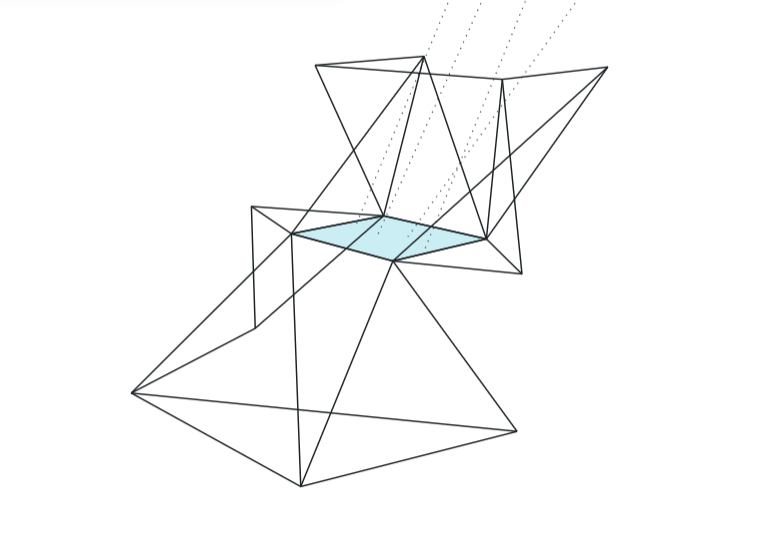
The central rhomboid represents the holographic plate: a thin, transparent plane where light from the recorded physical object interferes with reference light, creating a recorded holographic volume in front of and behind that plane.
The surrounding lines define the limits of view and the spatial relationships between the plate, the object space and the viewing zone reconstructed by the hologram.
The dotted lines indicate the direction of viewing, while the triangular symbols suggest possible observer positions.
The 3D model both visualises and distorts these relationships, responding to the processes and errors of modelling. It is no longer simply an attempt at explanation, but a drawing in its own right.